Sales Report
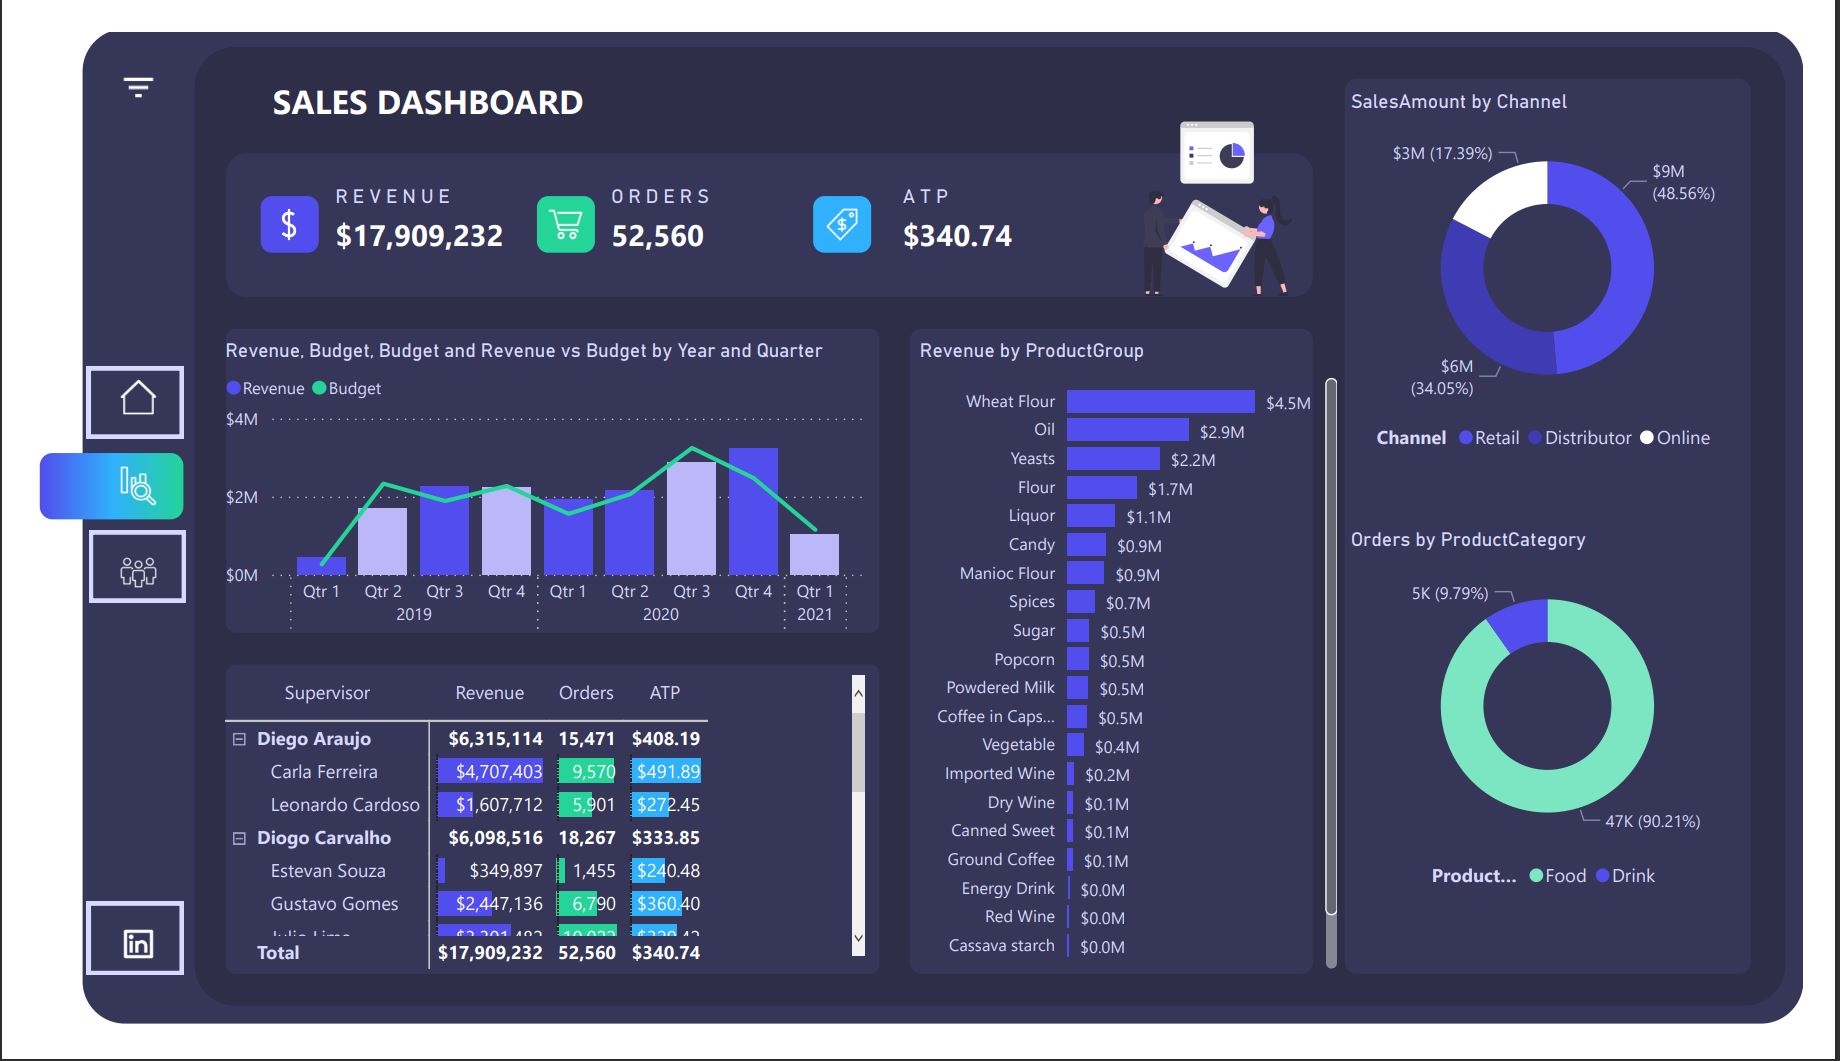
This project analyses the sales data of an E-commerce business and also ranks the salespersons
Project was done using power BI
Data Analyst|Data Engineer skilled in SQL , Python,Microsoft Power BI, Tableau and Azure
This project analyses the sales data of an E-commerce business and also ranks the salespersons
Project was done using power BI
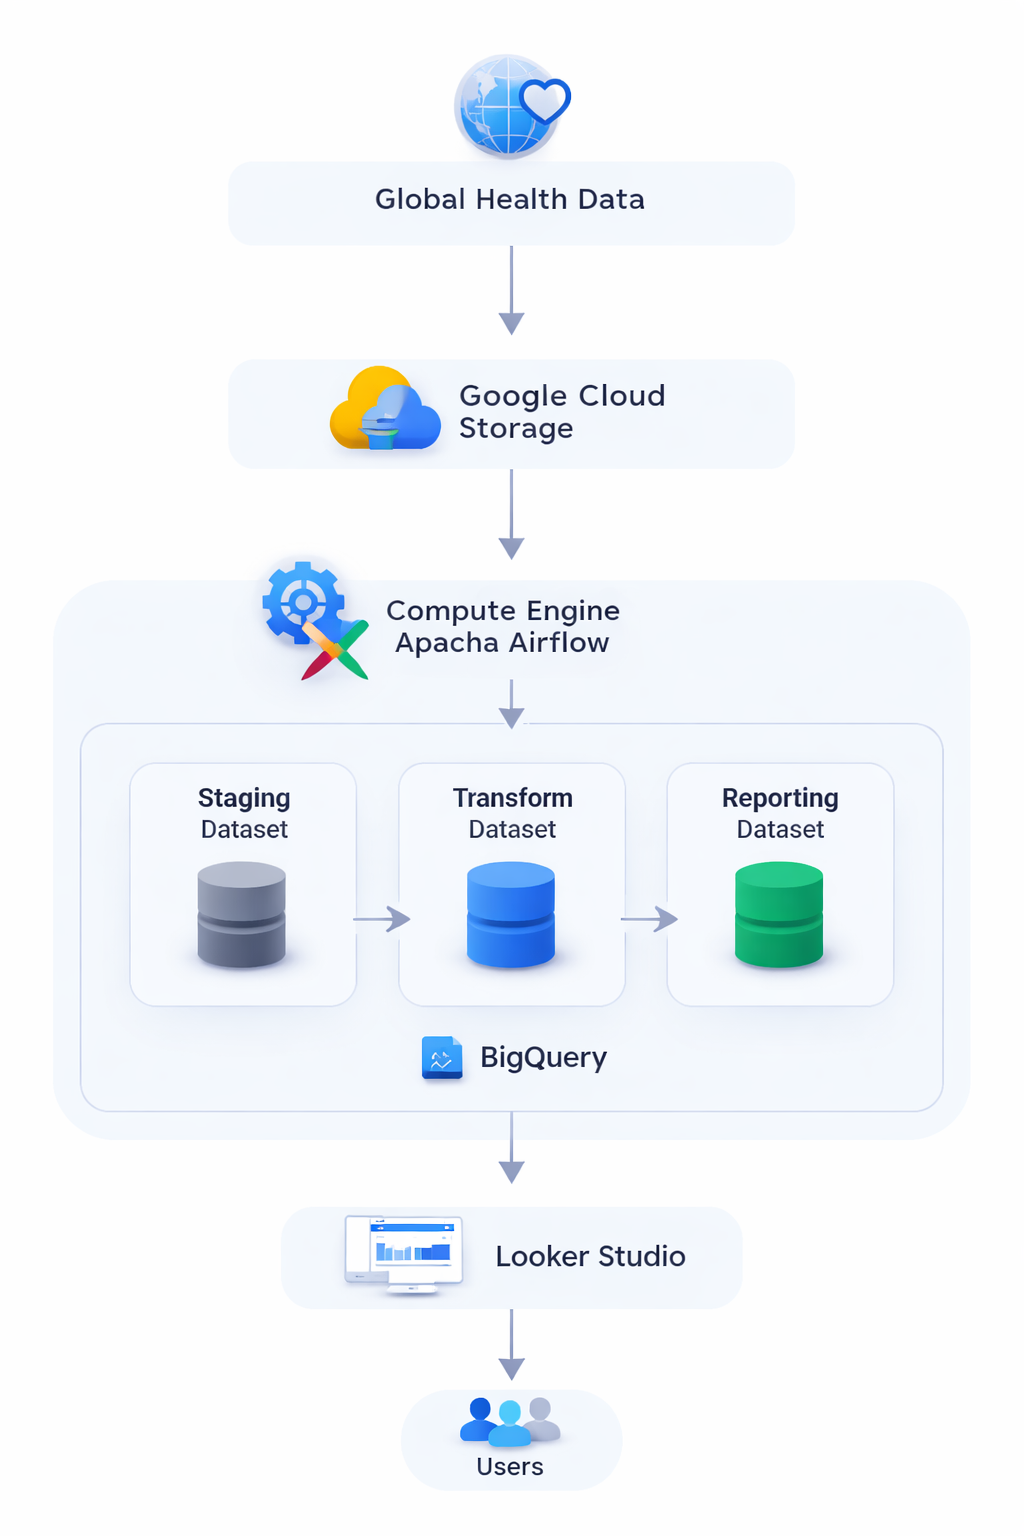
This project demonstrates a modern, scalable ELT pipeline on Google Cloud. It ingests and processes 1M+ global health records daily from Cloud Storage, builds a Medallion Lakehouse in BigQuery (Bronze → Silver → Gold), and delivers country-specific insights via governed views in Looker and Looker Studio.
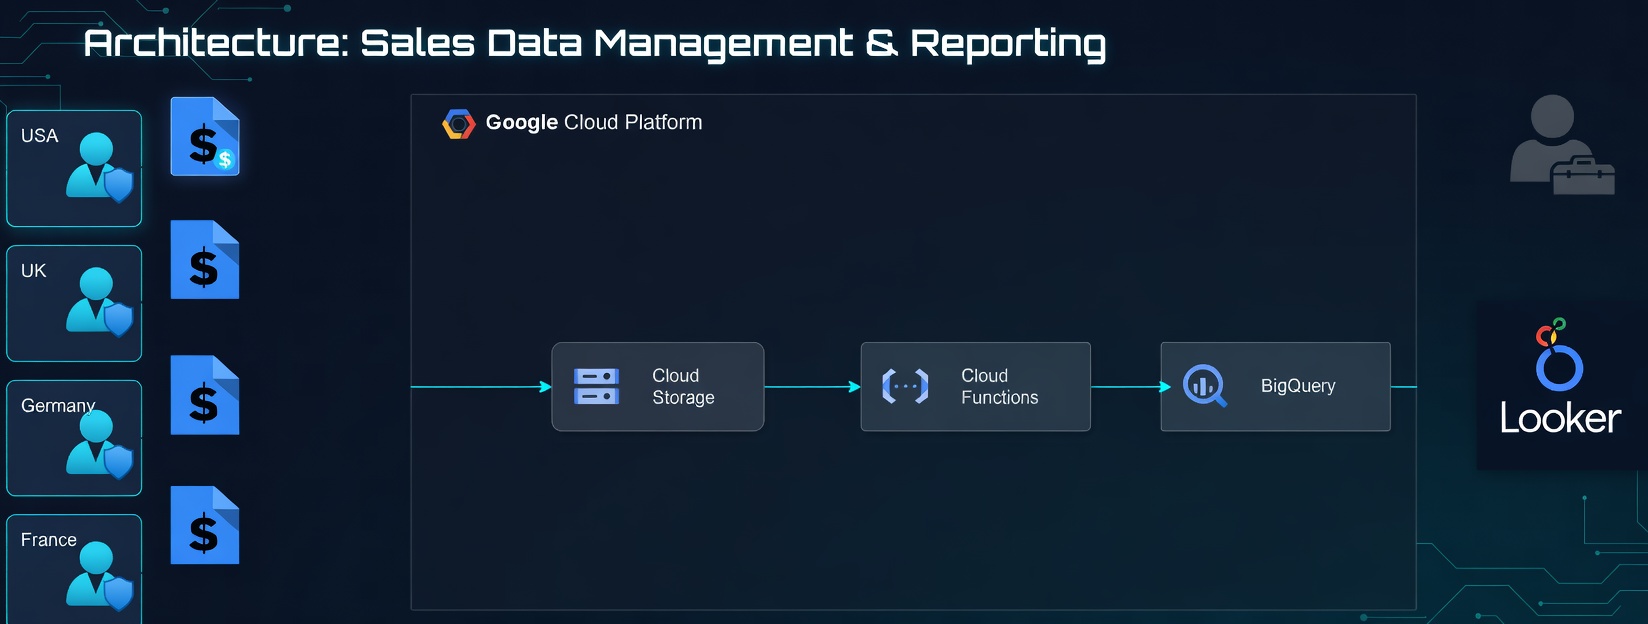
This repository contains code and configuration files for Building an Automated Data Pipeline for Sales Data in Google Cloud | GCP Data Engineering Project. This project demonstrates the integration of several GCP services to create an efficient and automated data pipeline for sales data.
1.Web Portal: Built with Python Flask to allow users to upload sales data files. 2.Storage: Uploaded files are stored in a GCS bucket. 3.Cloud Function: Automatically triggered when a file is uploaded to the GCS bucket, extracts data from the file, and loads it into BigQuery. 4.ETL Process: Extract, Transform, Load process implemented to handle data from raw upload to processed state. 5.Reporting: Summary views and dashboards in Looker Studio for key metrics, with filtering and drill-down capabilities.
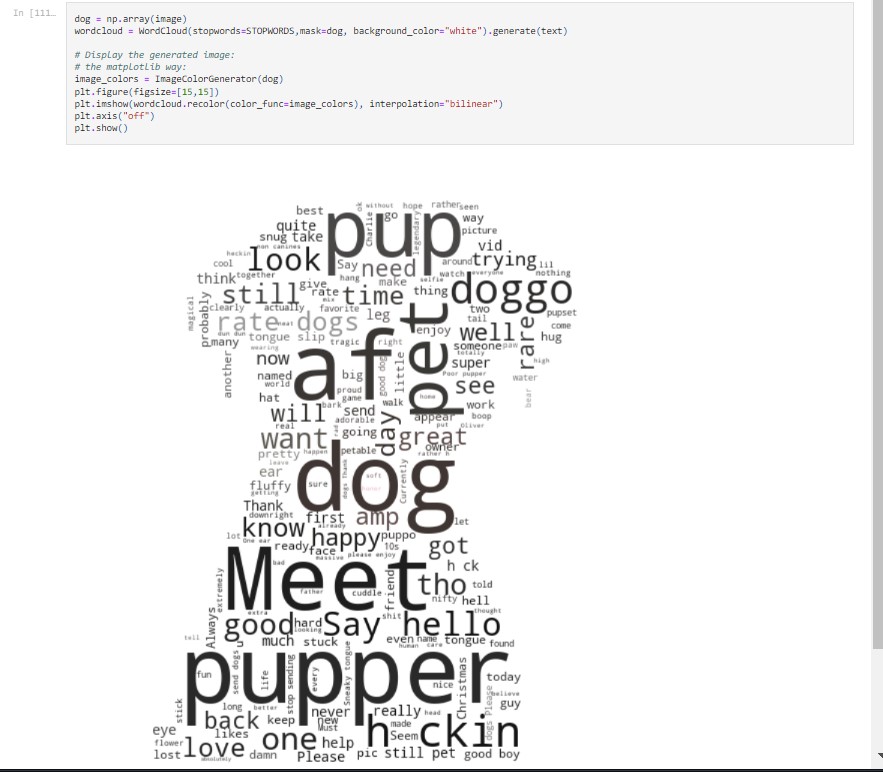
The dataset that I worked on is the tweet archive of Twitter user @dog_rates, also known as WeRateDogs. WeRateDogs is a Twitter account that rates people's dogs with a humorous comment about the dog I imported the various tables needed for the project twitter_archived,image_predictions and tweet_json respectively. After wrangling the data,and did my analysis, I got some insights from the wrangled data..
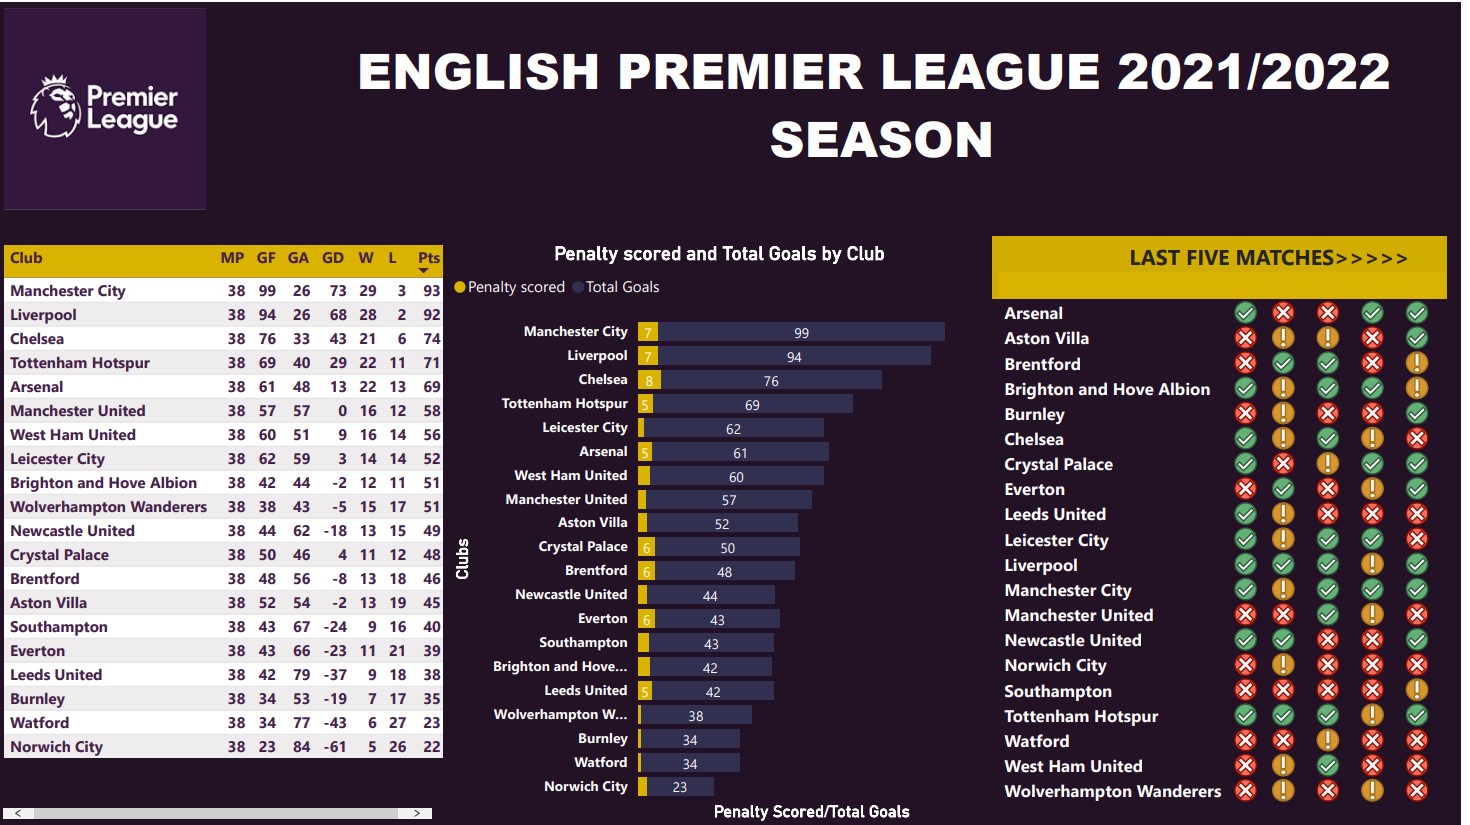
This project analyzes various metrics of the English premier league 2021/2022 season.
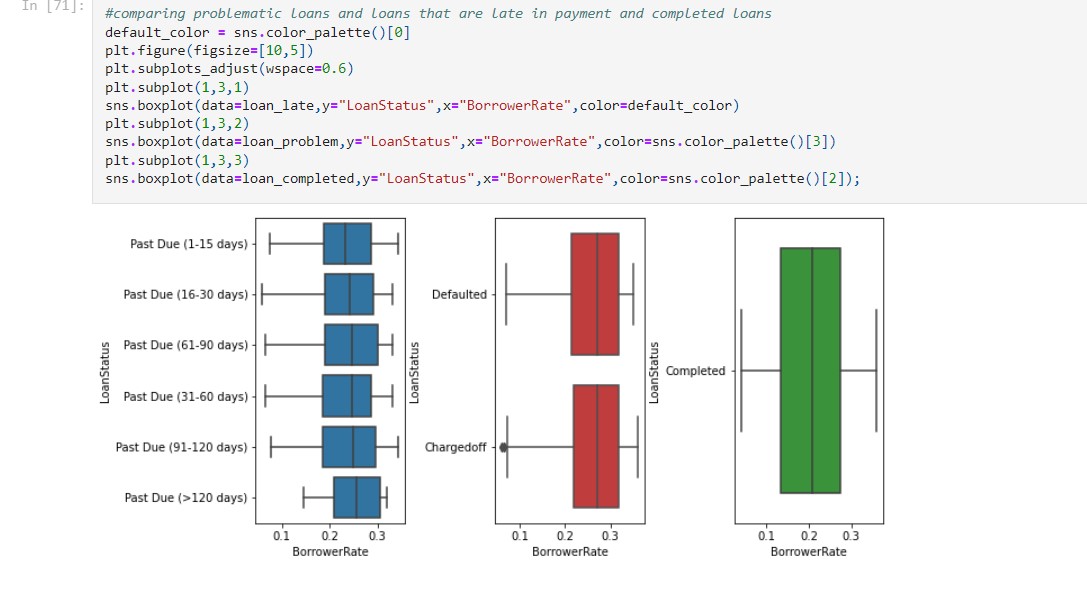
This project is divided into two major parts > In the first part, I conducted an exploratory data analysis on the loan data. I use data visualization libraries to perform cleaning and explore the dataset’s variables and understand the data’s structure,. The analysis in this part goes from from simple univariate relationships up through multivariate relationships. In the second part, I take the main findings from our exploration and convey them to others through an explanatory analysis. To this end, i created a slide deck that uses explanatory visualizations to communicate my results.
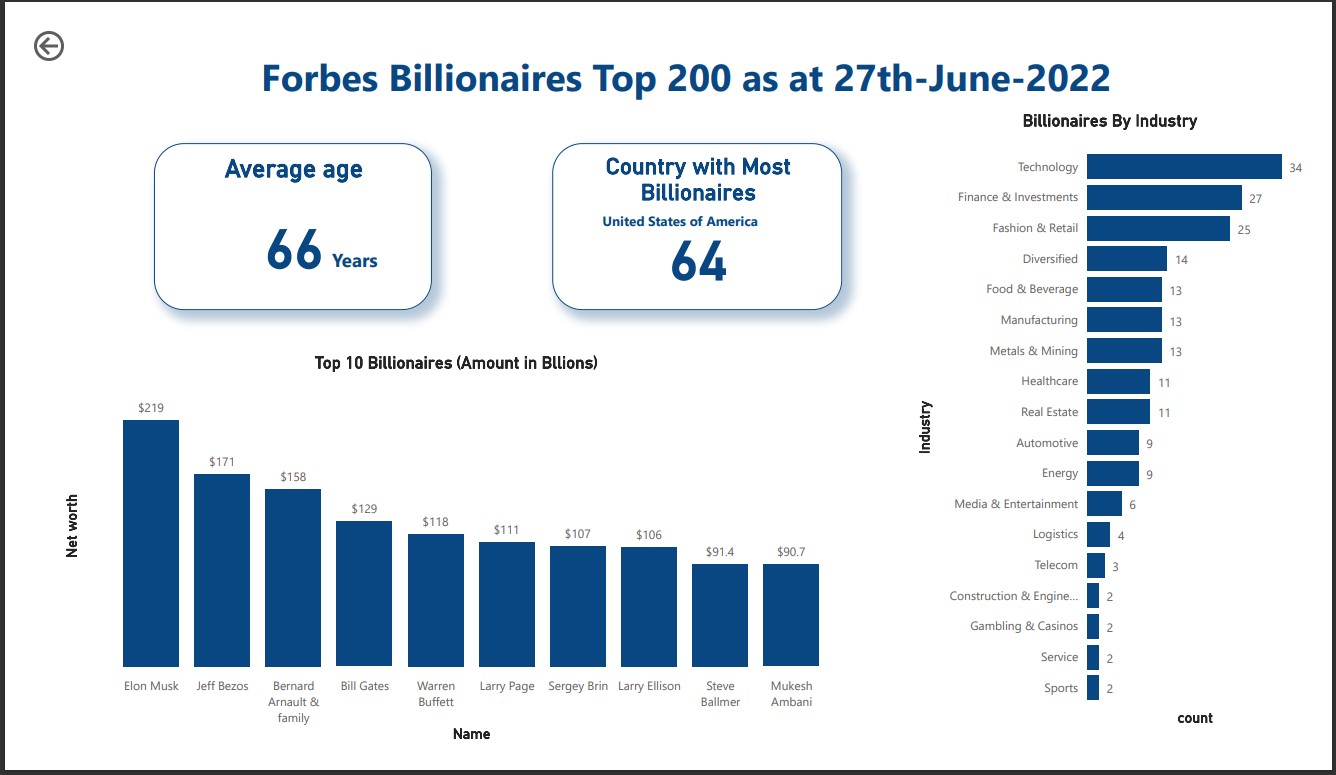
The dashboard contains analysis of the top 200 billionaires by forbes as at 27/07/2022
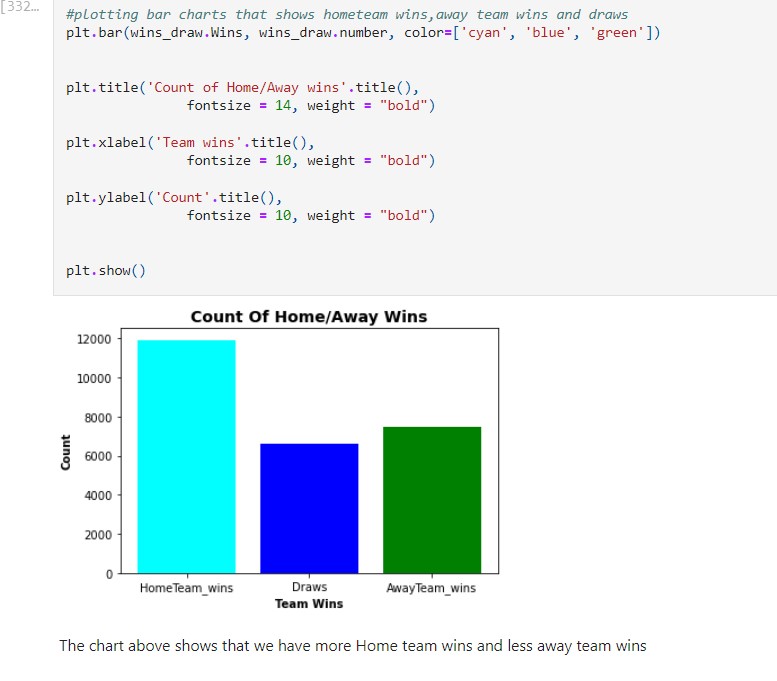
This project explores the soccer database gotten from Kaggle . It contains data for soccer matches, players, and teams from several European countries from 2008 to 2016. It has over 25,000 matches ,over 10,000 players,11 European Countries with their lead championship and Players and Teams' attributes.
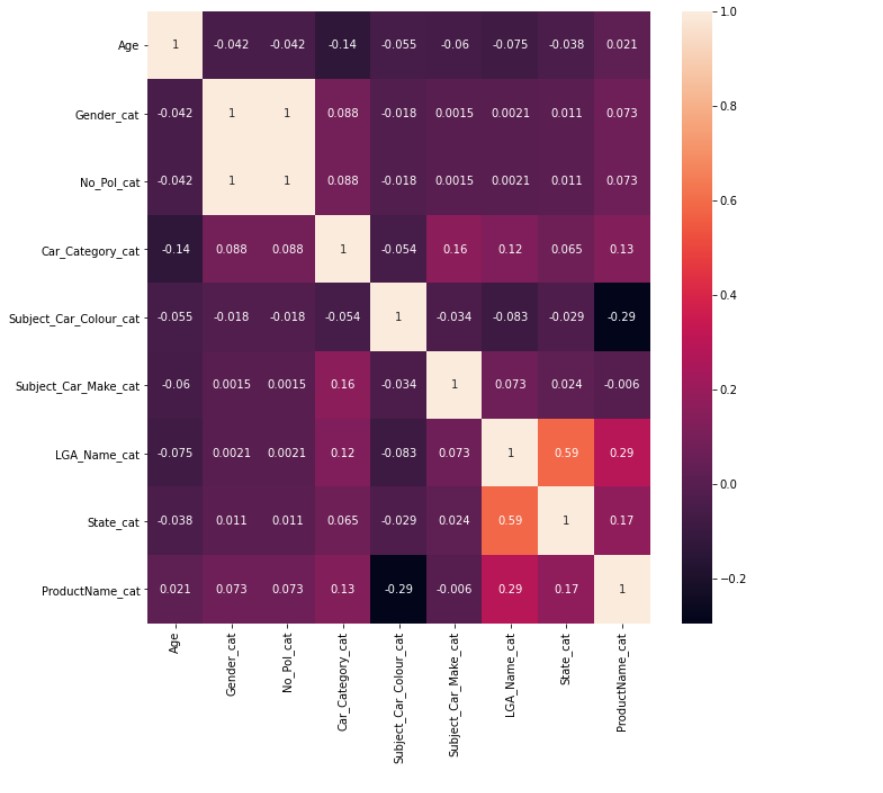
This project uses python language machine learning algorithms to predict if a client who owns an insurance policy will come for a claim after a three month period.
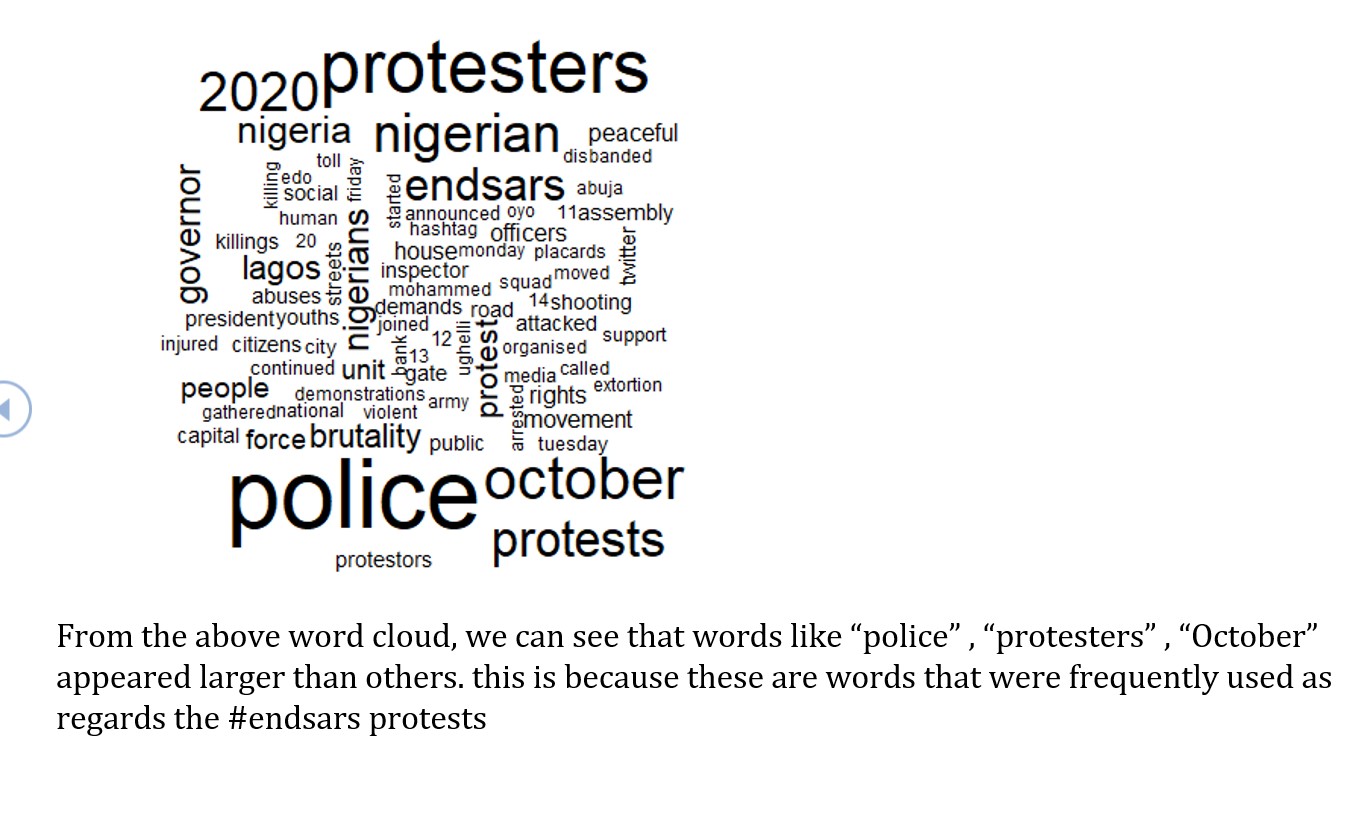
This is a text mining and Sentiment Analysis on the End Sars protest in nigeria.
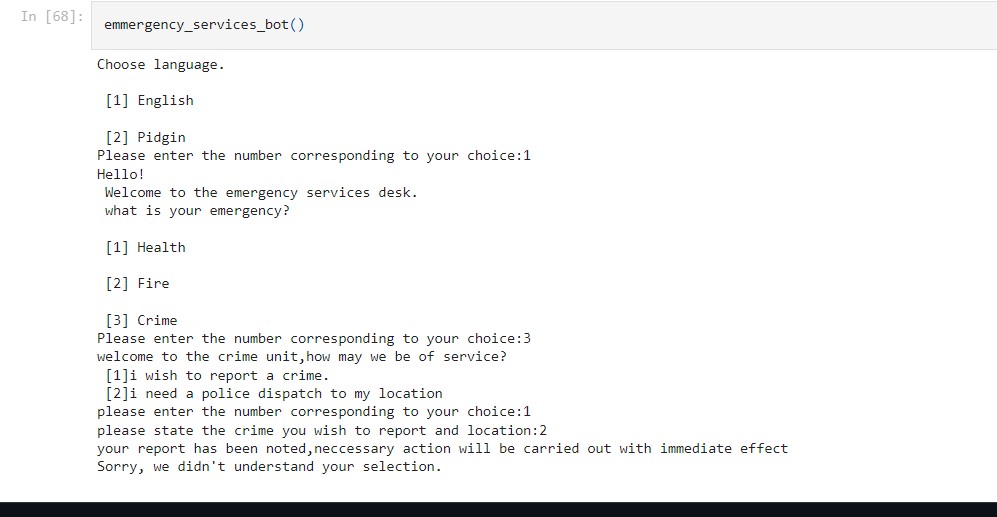
this is a rule based chatbot created using python for emergency services.
Abuja, Nigeria